Data & Analytics · 2026
Gillionaire Decor: Full Year Business Review
The Problem
Gillionaire Decor needed a data-backed review of its first full year of orders to guide 2027 strategy: which items and customers to prioritize, whether city performance differences were real, whether seasonal patterns existed, which customers were at risk of churning, and whether high-value orders could be predicted ahead of time.
The Approach
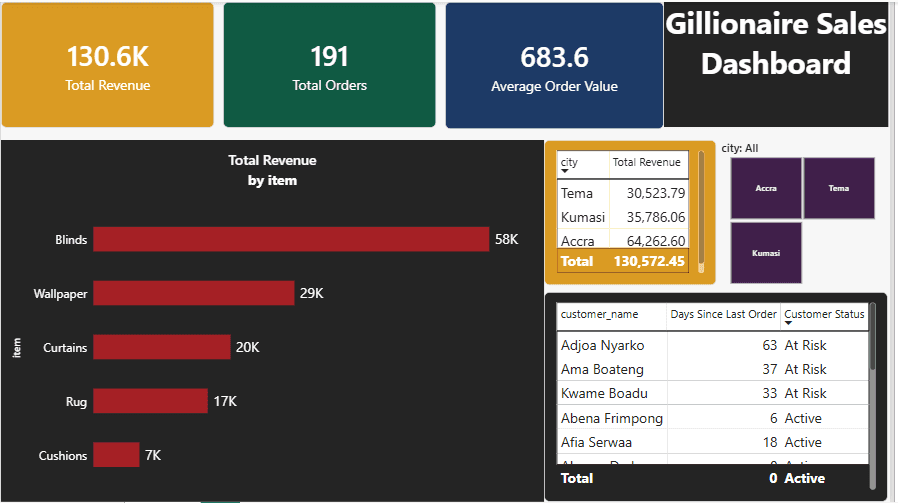
I cleaned a dataset of 197 raw orders down to 191 valid records, documenting every decision rather than guessing at missing values. From there I built item, customer, and city performance breakdowns, then used a one-way ANOVA to test whether the city difference was statistically real instead of assuming a visible gap was meaningful.
Implementation
A RandomForestClassifier predicting high-value orders initially scored 84.6% accuracy, which looked strong until I questioned it. Since item type alone already predicted price well, I ran an ablation test, retraining the model without the item feature and comparing it against a naive baseline. Accuracy without item (71.8%) fell below the baseline (79.5%), showing the model's real power came almost entirely from item type rather than timing or location. I then rebuilt the cleaning and churn detection independently in SQL and Power BI to confirm the findings held up. That process caught two real reference-date bugs, a hardcoded cutoff in SQL and Power BI's TODAY() function silently using the system date instead of the dataset's latest order, before all three tools matched exactly.
Result
Blinds led on revenue (GHC 57,785.89), the city difference turned out to be statistically insignificant (p = 0.196) despite Accra's higher total, and a clear seasonal pattern emerged with order volume nearly tripling from February to December. Three at-risk customers were identified with consistent results across Python, SQL, and Power BI.
Lessons Learned
The most valuable part of this project wasn't the model or the dashboard, it was refusing to trust either until they agreed with an independent source. A high-accuracy result can look impressive while mostly re-discovering a pattern already visible in a simple boxplot, and a dashboard can look complete while quietly using the wrong reference date.